Fund Aims
To achieve capital growth. In seeking to achieve its investment objective the fund will aim to deliver a return, net of fees, greater than that of the FTSE 250 ex Investment Trust Index over rolling 3 year periods. The fund primarily invests in a portfolio of medium sized UK companies.
Fund Manager
Richard Watts manager for:
15 years 4 months
Richard is Co-Head of Strategy, UK Small & Mid Cap in the UK Small & Mid Cap team. Before joining Jupiter, Richard worked at Merian Global Investors as a UK mid-cap portfolio manager. Prior to joining Merian, Richard worked at Orbis Investment Advisory as an equity analyst. Before this, he was a senior associate in the investment management division of PricewaterhouseCoopers. He began his investment career in 1998. Richard has a degree in Mathematical Sciences. He is IIMR-qualified and is a CFA® charterholder.
Fund Overview

Price
Bid
347.21p
Offer
347.21p
(22/04/2024)
Annual Management Charge
1.60%
Top 10 Holdings
|
| Stock Name |
% Weight |
| JET2 |
4.4%
|
| BIG YELLOW GROUP |
4.3%
|
| BELLWAY |
4.3%
|
| OSB GROUP |
3.7%
|
| MELROSE INDUSTRIES |
3.7%
|
| INTERMEDIATE CAPITAL GROUP |
3.4%
|
| DUNELM GROUP |
3.2%
|
| GAMES WORKSHOP GROUP |
3.2%
|
| GREGGS |
2.6%
|
| TRAINLINE |
2.5%
|
|
Total
|
35.3%
|
X-RayEquity Sector Allocation
| Industrial Goods & Services |
22.0%
|
| Real Estate |
12.7%
|
| Consumer Products & Services |
9.5%
|
| Technology |
9.4%
|
| Retail |
8.3%
|
| Financial Services |
8.2%
|
| Travel & Leisure |
6.9%
|
| Personal Care, Drug & Grocery Stores |
4.1%
|
| Insurance |
3.6%
|
| Other |
8.1%
|
| Cash and Equivalents |
4.3%
|
Data accurate at: 31/12/2023
Performance figures show total return with no initial charge and net income reinvested, except for Offshore funds which show gross income reinvested.
Cumulative performance figures are calculated from the previous working day.
Discrete performance figures are calculated from the previous month end.
Data accurate at: 31/12/2023
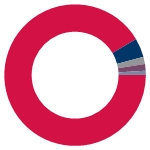
Asset Allocation
|
|
UK Equities
|
91.5%
|
|
|
Cash & Equivalents
|
4.3%
|
|
|
Investment Trusts
|
1.6%
|
|
|
Property
|
1.5%
|
|
|
Other
|
1.0%
|
X-Ray Equity Sector Allocation
ICB Industries
ICB Supersectors
ICB Sectors
ICB Subsectors
ICB Industries
| Consumer Discretionary |
|
27.4% |
| Industrials |
|
22.0% |
| Real Estate |
|
12.7% |
| Financials |
|
11.8% |
| Technology |
|
9.4% |
| Consumer Staples |
|
5.2% |
| Cash and Equivalents |
|
4.3% |
| Non-Classified |
|
2.6% |
| Telecommunications |
|
2.4% |
| Energy |
|
1.3% |
| Health Care |
|
0.7% |
ICB Supersectors
| Industrial Goods & Services |
|
22.0% |
| Real Estate |
|
12.7% |
| Consumer Products & Services |
|
9.5% |
| Technology |
|
9.4% |
| Retail |
|
8.3% |
| Financial Services |
|
8.2% |
| Travel & Leisure |
|
6.9% |
| Cash and Equivalents |
|
4.3% |
| Personal Care, Drug & Grocery Stores |
|
4.1% |
| Insurance |
|
3.6% |
| Media |
|
2.7% |
| Non-Classified |
|
2.6% |
| Telecommunications |
|
2.4% |
| Energy |
|
1.3% |
| Food, Beverage & Tobacco |
|
1.1% |
| Health Care |
|
0.7% |
ICB Sectors
| Real Estate Investment Trusts |
|
11.5% |
| Software & Computer Services |
|
9.4% |
| Industrial Support Services |
|
9.4% |
| Retailers |
|
8.3% |
| Travel & Leisure |
|
6.9% |
| Household Goods & Home Construction |
|
6.4% |
| Electronic & Electrical Equipment |
|
6.0% |
| Investment Banking & Brokerage Services |
|
4.5% |
| Cash and Equivalents |
|
4.3% |
| Personal Care, Drug & Grocery Stores |
|
4.1% |
| Finance & Credit Services |
|
3.7% |
| Aerospace & Defence |
|
3.7% |
| Non-life Insurance |
|
3.6% |
| Leisure Goods |
|
3.2% |
| Media |
|
2.7% |
| Non-Classified |
|
2.6% |
| Telecommunications Service Providers |
|
2.4% |
| Industrial Engineering |
|
1.7% |
| Industrial Transportation |
|
1.3% |
| Non-Renewable Energy |
|
1.3% |
| Real Estate Investment & Services |
|
1.2% |
| Food Producers |
|
1.1% |
| Pharmaceuticals & Biotechnology |
|
0.7% |
ICB Subsectors
| Consumer Digital Services |
|
6.7% |
| Home Construction |
|
6.4% |
| Airlines |
|
4.4% |
| Home Improvement Retailers |
|
4.4% |
| Cash and Equivalents |
|
4.3% |
| Storage REITs |
|
4.3% |
| Food Retailers & Wholesalers |
|
4.1% |
| Electronic Equipment: Control & Filter |
|
3.9% |
| Mortgage Finance |
|
3.7% |
| Aerospace |
|
3.7% |
| Property & Casualty Insurance |
|
3.6% |
| Office REITs |
|
3.6% |
| Industrial Suppliers |
|
3.5% |
| Asset Managers & Custodians |
|
3.4% |
| Toys |
|
3.2% |
| Computer Services |
|
2.7% |
| Media Agencies |
|
2.7% |
| Non-Classified |
|
2.6% |
| Travel & Tourism |
|
2.5% |
| Telecommunications Services |
|
2.4% |
| Professional Business Support Services |
|
2.4% |
| Other Specialty REITs |
|
2.1% |
| Business Training & Employment Agencies |
|
2.1% |
| Electrical Components |
|
2.0% |
| Machinery: Specialty |
|
1.7% |
| Specialty Retailers |
|
1.6% |
| Residential REITs |
|
1.5% |
| Transaction Processing Services |
|
1.5% |
| Commercial Vehicle-Equipment Leasing |
|
1.3% |
| Apparel Retailers |
|
1.3% |
| Oil: Crude Producers |
|
1.3% |
| Real Estate Services |
|
1.2% |
| Food Products |
|
1.1% |
| Investment Services |
|
1.0% |
| Diversified Retailers |
|
1.0% |
| Pharmaceuticals |
|
0.7% |
Interactive Sector Breakdown

Drill down to specific information by clicking the folders.
X-Ray
Regional
Allocation
Top 10 Holdings
|
|---|
| Stock name | % Weight | Country | Sector |
| 1 | JET2 | 4.4 %
| United Kingdom | Consumer Discretionary |
| 2 | BIG YELLOW GROUP | 4.3 %
| United Kingdom | Real Estate |
| 3 | BELLWAY | 4.3 %
| United Kingdom | Consumer Discretionary |
| 4 | OSB GROUP | 3.7 %
| United Kingdom | Financials |
| 5 | MELROSE INDUSTRIES | 3.7 %
| United Kingdom | Industrials |
| 6 | INTERMEDIATE CAPITAL GROUP | 3.4 %
| United Kingdom | Financials |
| 7 | DUNELM GROUP | 3.2 %
| United Kingdom | Consumer Discretionary |
| 8 | GAMES WORKSHOP GROUP | 3.2 %
| United Kingdom | Consumer Discretionary |
| 9 | GREGGS | 2.6 %
| United Kingdom | Consumer Staples |
| 10 | TRAINLINE | 2.5 %
| United Kingdom | Consumer Discretionary |
|
X-Ray FL Dual Aspect Analysis
|
|---|
| UK Equities | Int'l Equities | UK Bonds | Int'l Bonds | UK Gilts | Managed Funds | Property | Other | Cash & Equiv | Total |
| Technology | 9.4%
| | | | | | | | | 9.4%
|
| Telecommunications | 2.4%
| | | | | | | | | 2.4%
|
| Financials | 11.8%
| | | | | | | | | 11.8%
|
| Real Estate | 11.2%
| | | | | | 1.5%
| | | 12.7%
|
| Consumer Discretionary | 27.4%
| | | | | | | | | 27.4%
|
| Consumer Staples | 5.2%
| | | | | | | | | 5.2%
|
| Energy | 1.3%
| | | | | | | | | 1.3%
|
| Health Care | 0.7%
| | | | | | | | | 0.7%
|
| Industrials | 22.0%
| | | | | | | | | 22.0%
|
| Cash and Equivalents | | | | | | | | | 4.3%
| 4.3%
|
| Non-Classified | 1.6%
| | | | | | | 1.0%
| | 2.6%
|
| Total | 93.1%
| | | | | | 1.5%
| 1.0%
| 4.3%
| 100.0%
|
Distribution Details
Income Frequency
Annually
Distribution Type
Dividend
Distribution Payment Basis
Net
Charges
Annual Management Charge
1.60%
Distribution Dates
| Ex dividend date(s) |
Income payment date(s) |
| 01st August |
30th September |
Aims & Benchmark
Benchmark
FTSE 250 ex Investment Trust Index
IA sector
UK All Companies
Aims
To achieve capital growth. In seeking to achieve its investment objective the fund will aim to deliver a return, net of fees, greater than that of the FTSE 250 ex Investment Trust Index over rolling 3 year periods. The fund primarily invests in a portfolio of medium sized UK companies.
Fund Administration
Fund Trustee/Depository
Northern Trust Global Services Limited
Fund Administrator
Northern Trust Global Services Limited
Fund Registrar
SS&C TECHNOLOGIES INC
Fund Custodian
The Northern Trust Company
Fund Background
Valuation point
Daily 12:00
Fund currency
Pound Sterling
Fund domicile
United Kingdom
Group Details
Group name
Jupiter Unit Trust Managers Limited
Group address
The Zig Zag Building, 70 Victoria Street, London, SW1E 6SQ
Group telephone
020 3817 1063
Dealing telephone
0800 561 4000
Dealing
Minimum regular savings
£250
Settlement period: buy
4 days
Settlement period: sell
4 days
Data accurate at: 31/12/2023
Concentration Coefficient*
39

*A measure of portfolio concentration, e.g. where the fund coefficient is 25, this means the portfolio concentration is equivalent to holding 25 equally weighted stocks.
Risk Factors
Concentrated Portfolio
Yes
Investments Long Term
Yes
| Fund Specific Risks |
-
Concentrated Portfolio - The fund may invest in a relatively smaller number of stocks. This stock
concentration may carry more risk than funds spread across a larger number of companies.
-
Smaller Companies - The fund invests in smaller companies. Smaller companies shares can be more volatile
and less liquid than larger company shares, so smaller companies funds can carry more risk.
-
Value Of Investments - The value of investments, and any income can fall, as well as rise, so you could get
back less than you invested. Neither capital nor income is guaranteed.
-
Investments Long Term - Investments should be regarded as long term and are not suitable for money which may
be needed in the short term, you should always have a sufficient cash reserve.
|

 Home Construction
 United Kingdom
 Cash and Equivalents
 Direct Property and REITs
 Non-Classified