Fund Aims
To deliver capital and income growth and provide a total return in excess of that of the FTSE All-Share TR Index by investing at least 70% of its assets in the shares of companies incorporated or domiciled in the UK. Up to 10% of assets may be invested in worldwide companies which are listed on an exchange in the UK. The Company may invest up to 20% of its assets in non-UK equities from countries worldwide.
Fund Manager
Nick Train manager for:
17 years 9 months
Nick Train is Investment Adviser to Finsbury Growth & Income Trust PLC, and Investment Adviser to the CF Lindsell Train UK Equity Fund and Lindsell Train Global Equity Fund. Nick Train was with GT for 17 years where he successfully managed the GT Income Fund for some 13 years. Subsequently he spent two years with M&G (and was appointed Head of Global Equities), leaving to form Lindsell Train with Michael Lindsell in December 2000.
Fund Overview

Price
Bid
499.72p
Offer
499.72p
(18/04/2024)
Annual Management Charge
0.60%
Top 10 Holdings
|
| Stock Name |
% Weight |
| SAGE GROUP |
9.9%
|
| RELX |
9.9%
|
| EXPERIAN |
9.8%
|
| DIAGEO |
9.8%
|
| LONDON STOCK EXCHANGE GROUP |
9.6%
|
| UNILEVER |
8.7%
|
| MONDELEZ INTERNATIONAL |
7.6%
|
| BURBERRY GROUP |
5.8%
|
| HEINEKEN NV |
5.6%
|
| SCHRODERS |
4.9%
|
|
Total
|
81.6%
|
Equity Sector Allocation
| Food, Beverage & Tobacco |
29.4%
|
| Financial Services |
19.2%
|
| Technology |
9.9%
|
| Media |
9.9%
|
| Industrial Goods & Services |
9.8%
|
| Personal Care, Drug & Grocery Stores |
8.7%
|
| Consumer Products & Services |
5.8%
|
| Real Estate |
2.9%
|
| Travel & Leisure |
2.2%
|
| Non-Classified |
2.1%
|
| Other |
0.0%
|
Data accurate at: 29/02/2024
Performance figures show total return with no initial charge and net income reinvested, except for Offshore funds which show gross income reinvested.
Cumulative performance figures are calculated from the previous working day.
Discrete performance figures are calculated from the previous month end.
Data accurate at: 29/02/2024
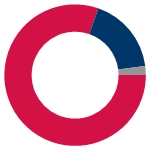
Asset Allocation
|
|
UK Equities
|
80.3%
|
|
|
International Equities
|
17.6%
|
|
|
Other
|
2.1%
|
Equity Sector Allocation
ICB Industries
ICB Supersectors
ICB Sectors
ICB Subsectors
ICB Industries
| Consumer Staples |
|
38.2% |
| Financials |
|
19.2% |
| Consumer Discretionary |
|
17.9% |
| Technology |
|
9.9% |
| Industrials |
|
9.8% |
| Real Estate |
|
2.9% |
| Non-Classified |
|
2.1% |
ICB Supersectors
| Food, Beverage & Tobacco |
|
29.4% |
| Financial Services |
|
19.2% |
| Technology |
|
9.9% |
| Media |
|
9.9% |
| Industrial Goods & Services |
|
9.8% |
| Personal Care, Drug & Grocery Stores |
|
8.7% |
| Consumer Products & Services |
|
5.8% |
| Real Estate |
|
2.9% |
| Travel & Leisure |
|
2.2% |
| Non-Classified |
|
2.1% |
| Retail |
|
<0.1% |
ICB Sectors
| Beverages |
|
21.9% |
| Software & Computer Services |
|
9.9% |
| Media |
|
9.9% |
| Industrial Support Services |
|
9.8% |
| Investment Banking & Brokerage Services |
|
9.7% |
| Finance & Credit Services |
|
9.6% |
| Personal Care, Drug & Grocery Stores |
|
8.7% |
| Food Producers |
|
7.6% |
| Personal Goods |
|
5.8% |
| Real Estate Investment & Services |
|
2.9% |
| Travel & Leisure |
|
2.2% |
| Non-Classified |
|
2.1% |
| Retailers |
|
<0.1% |
ICB Subsectors
| Distillers & Vintners |
|
12.6% |
| Software |
|
9.9% |
| Publishing |
|
9.9% |
| Professional Business Support Services |
|
9.8% |
| Asset Managers & Custodians |
|
9.7% |
| Financial Data & Systems |
|
9.6% |
| Personal Products |
|
8.7% |
| Food Products |
|
7.6% |
| Clothing & Accessories |
|
5.8% |
| Brewers |
|
5.6% |
| Soft Drinks |
|
3.6% |
| Real Estate Services |
|
2.9% |
| Non-Classified |
|
2.1% |
| Recreational Services |
|
1.9% |
| Restaurants & Bars |
|
0.3% |
| Specialty Retailers |
|
<0.1% |
Interactive Sector Breakdown

Drill down to specific information by clicking the folders.
Breakdown By Market Cap (%)
Top 10 Holdings
|
|---|
| Stock name | % Weight | Country | Sector |
| 1 | SAGE GROUP | 9.9 %
| United Kingdom | Technology |
| 2 | RELX | 9.9 %
| United Kingdom | Consumer Discretionary |
| 3 | EXPERIAN | 9.8 %
| United Kingdom | Industrials |
| 4 | DIAGEO | 9.8 %
| United Kingdom | Consumer Staples |
| 5 | LONDON STOCK EXCHANGE GROUP | 9.6 %
| United Kingdom | Financials |
| 6 | UNILEVER | 8.7 %
| United Kingdom | Consumer Staples |
| 7 | MONDELEZ INTERNATIONAL | 7.6 %
| United States | Consumer Staples |
| 8 | BURBERRY GROUP | 5.8 %
| United Kingdom | Consumer Discretionary |
| 9 | HEINEKEN NV | 5.6 %
| Netherlands | Consumer Staples |
| 10 | SCHRODERS | 4.9 %
| United Kingdom | Financials |
|
FL Dual Aspect Analysis
|
|---|
| UK Equities | Int'l Equities | UK Bonds | Int'l Bonds | UK Gilts | Managed Funds | Property | Other | Cash & Equiv | Total |
| Technology | 9.9%
| | | | | | | | | 9.9%
|
| Financials | 19.2%
| | | | | | | | | 19.2%
|
| Real Estate | 2.9%
| | | | | | | | | 2.9%
|
| Consumer Discretionary | 16.3%
| 1.6%
| | | | | | | | 17.9%
|
| Consumer Staples | 22.2%
| 16.0%
| | | | | | | | 38.2%
|
| Industrials | 9.8%
| | | | | | | | | 9.8%
|
| Non-Classified | | | | | | | | 2.1%
| | 2.1%
|
| Total | 80.3%
| 17.6%
| | | | | | 2.1%
| | 100.0%
|
Distribution Details
Income Frequency
Biannually
Distribution Type
Dividend
Charges
Annual Management Charge
0.60%
Distribution Dates
| Ex dividend date(s) |
Income payment date(s) |
| 01st December |
31st January |
| 01st June |
30th September |
Aims & Benchmark
Benchmark
FTSE All Share TR Index
IA sector
UK All Companies
Aims
To deliver capital and income growth and provide a total return in excess of that of the FTSE All-Share TR Index by investing at least 70% of its assets in the shares of companies incorporated or domiciled in the UK. Up to 10% of assets may be invested in worldwide companies which are listed on an exchange in the UK. The Company may invest up to 20% of its assets in non-UK equities from countries worldwide.
Fund Administration
Fund Trustee/Depository
BNY Mellon Trust & Depositary (UK) Ltd
Fund Administrator
Link Fund Administrators Limited
Fund Registrar
Link Fund Administrators Limited
Fund Custodian
The Bank of New York Mellon (International) Limited
Fund Background
Valuation point
Daily 10:00
Fund currency
Pound Sterling
Fund domicile
United Kingdom
Group Details
Group name
Lindsell Train Limited
Group address
2 Queen Anne's Gate Buildings
Dartmouth Street
London
SW1H 9BP
Group telephone
020 7227 8200
Dealing
Settlement period: buy
4 days
Settlement period: sell
4 days
Data accurate at: 29/02/2024
Concentration Coefficient*
13

*A measure of portfolio concentration, e.g. where the fund coefficient is 25, this means the portfolio concentration is equivalent to holding 25 equally weighted stocks.
Risk Factors
Concentrated Portfolio
Yes
Investments Long Term
Yes
| Fund Specific Risks |
-
Charges to Capital - Part, or all of the periodic annual management fee(s) and expenses may be charged to
capital which could increase the potential for the capital value of your investment to be eroded. Your capital could
also decrease if income withdrawals exceed the growth rate of the fund(s).
-
Concentrated Portfolio - The fund may invest in a relatively smaller number of stocks. This stock
concentration may carry more risk than funds spread across a larger number of companies.
-
Smaller Companies - The fund invests in smaller companies. Smaller companies shares can be more volatile
and less liquid than larger company shares, so smaller companies funds can carry more risk.
-
Value Of Investments - The value of investments, and any income can fall, as well as rise, so you could get
back less than you invested. Neither capital nor income is guaranteed.
-
Investments Long Term - Investments should be regarded as long term and are not suitable for money which may
be needed in the short term, you should always have a sufficient cash reserve.
-
Exchange Rate - This fund invests in securities outside the UK. The value of investments and any income from
them may therefore decrease or increase as a result of changes in exchange rates between currencies.
-
Higher Risk - This fund is specifically aimed at sophisticated investors and is particularly high risk, because
it concentrates on a region that may be exposed to unusual political or economic risks. You should only invest if you are
comfortable with the specific risks pertaining to the fund in question. If you are not familiar with these you should ask
us for a copy of the provider's key features and brochure.
|

 Distillers & Vintners
 United Kingdom
 United States
 Netherlands
 France
 Non-Classified