Fund Aims
The Fund aims to maximise total return through dividend yield and capital appreciation by investing in high yielding or undervalued securities of companies in Asia, excluding Japan. Investors should be aware that the Fund's capital is at risk and there is no guarantee that the Fund will achieve its investment objective over any particular period or at all.
Fund Managers
Raymond Chan manager for:
12 years 6 months
Raymond Chan, CFA, was born in Hong Kong in 1965. He is a portfolio manager and CIO Equity Asia Pacific with Allianz Global Investors, which he joined in 1998. He is responsible for all AllianzGI investment professionals in Asia and has more than 22 years of investment-industry experience. Raymond was previously an associate director with Barclays Global. He has a BA in economics from the University of Durham and an MA in finance and investment from the University of Exeter. Outside of fund management, Raymond enjoys tennis.
manager for:
12 years 6 months
Pan Yu Ming is currently a senior portfolio manager, with responsibilities for Far East ex Japan portfolios. He is also a member of the regional equity portfolio management team. He joined the group as an analyst in 1999, covering Thailand and the utilities/energy sector. He then became the lead portfolio manager for the Singapore balanced funds, as well as the Singapore country fund and the Malaysia country fund in the Singapore office. His last position with us was the Portfolio Manager in the Hong Kong office responsible for the Allianz Greater China Dynamic Fund and the Allianz China A-Shares Fund. He also co-managed the Allianz Little Dragons Fund and the Allianz Emerging Asia Equity Fund. He left the group in 2010 and rejoins in 2013. Prior to re-joining us, he was the lead manager of the Greater China Absolute Return hedge fund, and managed the research process for CSOP Asset Management, Hong Kong.
He graduated with a Bachelor of Business in 1997 and received a Master of Business in 1999, both from Nanyang Technological University. He has also completed the examination by the Association of Chartered Certified Accountants (UK) in 2000, and received his CFA charter in 2003.
Fund Overview

Price
Bid
1464.49p
Offer
1464.49p
(02/04/2026)
Annual Management Charge
1.75%
Top 10 Holdings
|
| Stock Name |
% Weight |
| TAIWAN SEMICONDUCTOR MANUFACTURING COMPANY LIMITED |
9.8%
|
| ALIBABA GROUP HOLDING LIMITED |
7.3%
|
| TENCENT HOLDINGS LIMITED |
7.1%
|
| SAMSUNG ELECTRONICS CO. LTD |
6.8%
|
| COST OF CURRENCY (CA CC99 912000000GBP |
4.4%
|
| HDFC BANK LIMITED |
3.8%
|
| SINGAPORE TELECOMMUNICATIONS LIMITED |
3.8%
|
| RELIANCE INDUSTRIES LIMITED |
3.6%
|
| PING AN INSURANCE (GROUP) COMPANY OF CHINA |
3.3%
|
| SK HYNIX |
3.3%
|
|
Total
|
53.1%
|
Equity Sector Allocation
| Technology |
28.2%
|
| Banks |
12.7%
|
| Telecommunications |
12.6%
|
| Industrial Goods & Services |
8.4%
|
| Retail |
8.3%
|
| Energy |
5.1%
|
| Insurance |
4.7%
|
| Financial Services |
3.6%
|
| Health Care |
3.5%
|
| Basic Resources |
3.1%
|
| Other |
9.8%
|
Data accurate at: 30/11/2025
Performance figures show total return with no initial charge and net income reinvested, except for Offshore funds which show gross income reinvested.
Cumulative performance figures are calculated from the previous working day.
Discrete performance figures are calculated from the previous month end.
Data accurate at: 30/11/2025
Asset Allocation

|
|
International Equities
|
97.3%
|
|
|
Other
|
2.7%
|
Equity Sector Allocation
ICB Industries
ICB Supersectors
ICB Sectors
ICB Subsectors
ICB Industries
| Technology |
|
28.2% |
| Financials |
|
21.0% |
| Telecommunications |
|
12.6% |
| Consumer Discretionary |
|
12.3% |
| Industrials |
|
8.4% |
| Energy |
|
5.1% |
| Health Care |
|
3.5% |
| Basic Materials |
|
3.1% |
| Non-Classified |
|
2.7% |
| Real Estate |
|
2.1% |
| Consumer Staples |
|
1.1% |
ICB Supersectors
| Technology |
|
28.2% |
| Banks |
|
12.7% |
| Telecommunications |
|
12.6% |
| Industrial Goods & Services |
|
8.4% |
| Retail |
|
8.3% |
| Energy |
|
5.1% |
| Insurance |
|
4.7% |
| Financial Services |
|
3.6% |
| Health Care |
|
3.5% |
| Basic Resources |
|
3.1% |
| Automobiles & Parts |
|
3.0% |
| Non-Classified |
|
2.7% |
| Real Estate |
|
2.1% |
| Food, Beverage & Tobacco |
|
1.1% |
| Consumer Products & Services |
|
0.5% |
| Travel & Leisure |
|
0.5% |
ICB Sectors
| Technology Hardware & Equipment |
|
20.3% |
| Banks |
|
12.7% |
| Telecommunications Equipment |
|
8.8% |
| Retailers |
|
8.3% |
| Software & Computer Services |
|
7.9% |
| Electronic & Electrical Equipment |
|
7.2% |
| Non-Renewable Energy |
|
4.9% |
| Telecommunications Service Providers |
|
3.8% |
| Investment Banking & Brokerage Services |
|
3.6% |
| Life Insurance |
|
3.3% |
| Precious Metals & Mining |
|
3.0% |
| Automobiles & Parts |
|
3.0% |
| Non-Classified |
|
2.7% |
| Real Estate Investment & Services |
|
2.1% |
| Pharmaceuticals & Biotechnology |
|
2.0% |
| Health Care Providers |
|
1.5% |
| Non-life Insurance |
|
1.4% |
| Industrial Transportation |
|
1.1% |
| Food Producers |
|
1.1% |
| Personal Goods |
|
0.5% |
| Travel & Leisure |
|
0.5% |
| Renewable Energy |
|
0.3% |
| Industrial Metals & Mining |
|
<0.1% |
ICB Subsectors
| Semiconductors |
|
14.0% |
| Banks |
|
12.7% |
| Telecommunications Equipment |
|
8.8% |
| Consumer Digital Services |
|
7.9% |
| Diversified Retailers |
|
7.3% |
| Electrical Components |
|
6.0% |
| Oil Refining and Marketing |
|
4.9% |
| Telecommunications Services |
|
3.8% |
| Life Insurance |
|
3.3% |
| Gold Mining |
|
3.0% |
| Non-Classified |
|
2.7% |
| Electronic Components |
|
2.6% |
| Computer Hardware |
|
2.4% |
| Investment Services |
|
2.4% |
| Real Estate Holding and Development |
|
2.1% |
| Automobiles |
|
2.0% |
| Pharmaceuticals |
|
2.0% |
| Health Care Facilities |
|
1.5% |
| Property & Casualty Insurance |
|
1.4% |
| Production Technology Equipment |
|
1.3% |
| Electronic Equipment: Other |
|
1.2% |
| Asset Managers & Custodians |
|
1.2% |
| Marine Transportation |
|
1.1% |
| Food Products |
|
1.1% |
| Specialty Retailers |
|
1.0% |
| Auto Parts |
|
1.0% |
| Cosmetics |
|
0.5% |
| Travel & Tourism |
|
0.5% |
| Renewable Energy Equipment |
|
0.3% |
| Aluminum |
|
<0.1% |
Interactive Sector Breakdown

Drill down to specific information by clicking the folders.
Fixed Interest Analysis
Fixed Interest Maturity Profile
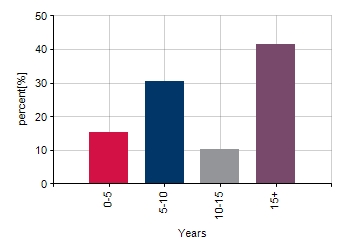
Fixed Interest Quality Profile
Breakdown By Market Cap (%)
Top 10 Holdings
|
|---|
| Stock name | % Weight | Country | Sector |
| 1 | TAIWAN SEMICONDUCTOR MANUFACTURING COMPANY LIMITED | 9.8 %
| Taiwan | Technology |
| 2 | ALIBABA GROUP HOLDING LIMITED | 7.3 %
| United States | Consumer Discretionary |
| 3 | TENCENT HOLDINGS LIMITED | 7.1 %
| Hong Kong | Technology |
| 4 | SAMSUNG ELECTRONICS CO. LTD | 6.8 %
| South Korea | Telecommunications |
| 5 | COST OF CURRENCY (CA CC99 912000000GBP | 4.4 %
| Non-Classified | Non-Classified |
| 6 | HDFC BANK LIMITED | 3.8 %
| India | Financials |
| 7 | SINGAPORE TELECOMMUNICATIONS LIMITED | 3.8 %
| Singapore | Telecommunications |
| 8 | RELIANCE INDUSTRIES LIMITED | 3.6 %
| India | Energy |
| 9 | PING AN INSURANCE (GROUP) COMPANY OF CHINA | 3.3 %
| China | Financials |
| 10 | SK HYNIX | 3.3 %
| South Korea | Technology |
|
FL Dual Aspect Analysis
|
|---|
| UK Equities | Int'l Equities | UK Bonds | Int'l Bonds | UK Gilts | Managed Funds | Property | Other | Cash & Equiv | Total |
| Technology | | 28.2%
| | | | | | | | 28.2%
|
| Telecommunications | | 12.6%
| | | | | | | | 12.6%
|
| Financials | | 21.0%
| | | | | | | | 21.0%
|
| Real Estate | | 2.1%
| | | | | | | | 2.1%
|
| Consumer Discretionary | | 12.3%
| | | | | | | | 12.3%
|
| Consumer Staples | | 1.1%
| | | | | | | | 1.1%
|
| Energy | | 5.1%
| | | | | | | | 5.1%
|
| Health Care | | 3.5%
| | | | | | | | 3.5%
|
| Industrials | | 8.4%
| | | | | | | | 8.4%
|
| Basic Materials | | 3.1%
| | | | | | | | 3.1%
|
| Non-Classified | | | | | | | | 2.7%
| | 2.7%
|
| Total | | 97.3%
| | | | | | 2.7%
| | 100.0%
|
Distribution Details
Income Frequency
Biannually
Distribution Payment Basis
Net
Charges
Discounted initial charge
0.000%
Net discounted AMC
0.875%
Annual Management Charge
1.75%
Distribution Dates
| Ex dividend date(s) |
Income payment date(s) |
| 01st July |
31st August |
| 01st January |
28th February |
Ratings
Aims & Benchmark
Benchmark
MSCI AC Asia ex Japan Total Return (Net)
IA sector
Asia Pacific Excluding Japan
Aims
The Fund aims to maximise total return through dividend yield and capital appreciation by investing in high yielding or undervalued securities of companies in Asia, excluding Japan. Investors should be aware that the Fund's capital is at risk and there is no guarantee that the Fund will achieve its investment objective over any particular period or at all.
Fund Administration
Fund Trustee/Depository
State Street Trustees Limited
Fund Administrator
DST Financial Services Europe
Fund Registrar
DST Financial Services International Limited
Fund Custodian
State Street Trustees Limited
Fund Background
Valuation point
Daily 12:00
Fund currency
Pound Sterling
Fund domicile
United Kingdom
Group Details
Group name
Allianz Global Investors (UK) Ltd
Group address
155 Bishopsgate
London
EC2M 3AD
Group telephone
0800 848 494
Dealing
Settlement period: buy
4 days
Settlement period: sell
4 days
Data accurate at: 30/11/2025
Concentration Coefficient*
23

*A measure of portfolio concentration, e.g. where the fund coefficient is 25, this means the portfolio concentration is equivalent to holding 25 equally weighted stocks.
Risk Factors
Concentrated Portfolio
Yes
Investments Long Term
Yes
| Fund Specific Risks |
-
Charges to Capital - Part, or all of the periodic annual management fee(s) and expenses may be charged to
capital which could increase the potential for the capital value of your investment to be eroded. Your capital could
also decrease if income withdrawals exceed the growth rate of the fund(s).
-
Emerging Markets - The fund invests in emerging markets. Generally less well regulated than the UK. There
is an increased chance of political and economic instability with less reliable custody, dealing and settlement
arrangements. The market(s) can be less liquid. If a fund investing in markets is affected by currency exchange rates,
the investment could either increase or decrease. These investments therefore carry more risk.
-
Concentrated Portfolio - The fund may invest in a relatively smaller number of stocks. This stock
concentration may carry more risk than funds spread across a larger number of companies.
-
Smaller Companies - The fund invests in smaller companies. Smaller companies shares can be more volatile
and less liquid than larger company shares, so smaller companies funds can carry more risk.
-
Value Of Investments - The value of investments, and any income can fall, as well as rise, so you could get
back less than you invested. Neither capital nor income is guaranteed.
-
Investments Long Term - Investments should be regarded as long term and are not suitable for money which may
be needed in the short term, you should always have a sufficient cash reserve.
-
Exchange Rate - This fund invests in securities outside the UK. The value of investments and any income from
them may therefore decrease or increase as a result of changes in exchange rates between currencies.
|

 Semiconductors
 Taiwan
 China
China South Korea
 India
India Hong Kong
 United States
 Singapore
 Non-Classified
 Malaysia
 Philippines
 Thailand