Fund Aims
The Fund’s objective is to deliver capital growth and inflation-protected income by investing in a globally diversified portfolio of listed infrastructure and infrastructure-related securities.
Fund Managers
Peter Meany manager for:
16 years 7 months
Peter joined Colonial First State Global Asset Management in January 2007 as Head of Global Listed Infrastructure Securities. Peter brings over 10 years’ experience in the infrastructure and utilities sectors. At Credit Suisse Equities (Australia), Peter was responsible for research coverage in these sectors. He received top rankings in a number of industry surveys and was involved in a number of company defining corporate transactions. Prior to CS, Peter was an analyst at Macquarie Equities when the infrastructure sector was in its infancy. Peter holds a Bachelor Economics (Finance) from Macquarie University.
manager for:
16 years 7 months
Andrew joined Colonial First State Global Asset Management in July 2005 as a senior analyst in the Core Australian Equities team. Over this time Andrew has analysed five industry sectors. He has also performed the role of backup Portfolio Manager. Prior to this, Andrew worked at Allianz Global Investors as a senior analyst investing in Australian equities. Before funds management, Andrew worked at Credit Suisse First Boston as an equities analyst and Australian & New Zealand Banking Group as a credit analyst. Andrew holds a Bachelor Business (First Class Honours) from the Queensland University of Technology (QUT) and was awarded the QUT University medal. He has completed the Graduate Diploma in Applied Finance and Investment from the Financial Services Institute of Australasia and is currently enrolled in the Australian Institute of Company Directors’ (AICD) Company Directors Course.
Fund Overview

Price
Bid
324.74p
Offer
324.74p
(25/04/2024)
Annual Management Charge
1.50%
Top 10 Holdings
|
| Stock Name |
% Weight |
| TRANSURBAN GROUP |
6.5%
|
| NEXTERA ENERGY INC |
6.3%
|
| DUKE ENERGY CORPORATION |
4.5%
|
| American Tower Corporation American Tower Corp Ord USD0.01 |
4.3%
|
| SOUTHERN COMPANY (THE) |
4.1%
|
| CHENIERE ENERGY |
3.9%
|
| UNION PACIFIC CORPORATION |
3.6%
|
| ENTERGY CORPORATION |
3.4%
|
| EVERSOURCE ENERGY |
3.4%
|
| XCEL ENERGY |
3.1%
|
|
Total
|
43.1%
|
Equity Sector Allocation
| Utilities |
48.2%
|
| Industrial Goods & Services |
24.5%
|
| Energy |
8.7%
|
| Real Estate |
7.1%
|
| Managed Funds |
6.5%
|
| Construction & Materials |
3.6%
|
| Telecommunications |
0.9%
|
| Non-Classified |
0.0%
|
Data accurate at: 31/03/2024
Performance figures show total return with no initial charge and net income reinvested, except for Offshore funds which show gross income reinvested.
Cumulative performance figures are calculated from the previous working day.
Discrete performance figures are calculated from the previous month end.
Data accurate at: 31/03/2024
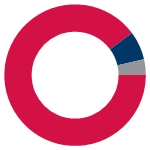
Asset Allocation
|
|
International Equities
|
89.4%
|
|
|
Managed Funds
|
6.5%
|
|
|
UK Equities
|
3.6%
|
|
|
Cash & Equivalents
|
0.5%
|
Equity Sector Allocation
ICB Industries
ICB Supersectors
ICB Sectors
ICB Subsectors
ICB Industries
| Utilities |
|
48.2% |
| Industrials |
|
28.1% |
| Energy |
|
8.7% |
| Real Estate |
|
7.1% |
| Managed Funds |
|
6.5% |
| Telecommunications |
|
0.9% |
| Cash and Equivalents |
|
0.5% |
| Non-Classified |
|
0.0% |
ICB Supersectors
| Utilities |
|
48.2% |
| Industrial Goods & Services |
|
24.5% |
| Energy |
|
8.7% |
| Real Estate |
|
7.1% |
| Managed Funds |
|
6.5% |
| Construction & Materials |
|
3.6% |
| Telecommunications |
|
0.9% |
| Cash and Equivalents |
|
0.5% |
| Non-Classified |
|
0.0% |
ICB Sectors
| Electricity |
|
35.9% |
| Industrial Transportation |
|
24.5% |
| Gas, Water & Multi-utilities |
|
12.3% |
| Non-Renewable Energy |
|
8.7% |
| Real Estate Investment Trusts |
|
7.1% |
| Managed Funds |
|
6.5% |
| Construction & Materials |
|
3.6% |
| Telecommunications Service Providers |
|
0.9% |
| Cash and Equivalents |
|
0.5% |
| Non-Classified |
|
0.0% |
ICB Subsectors
| Conventional Electricity |
|
35.9% |
| Transportation Services |
|
14.7% |
| Railroads |
|
9.8% |
| Pipelines |
|
8.7% |
| Infrastructure REITs |
|
7.1% |
| Multi-Utilities |
|
7.0% |
| Managed Funds |
|
6.5% |
| Construction |
|
3.6% |
| Gas Distribution |
|
2.9% |
| Water |
|
2.4% |
| Telecommunications Services |
|
0.9% |
| Cash and Equivalents |
|
0.5% |
| Non-Classified |
|
0.0% |
Interactive Sector Breakdown

Drill down to specific information by clicking the folders.
Breakdown By Market Cap (%)
Top 10 Holdings
|
|---|
| Stock name | % Weight | Country | Sector |
| 1 | TRANSURBAN GROUP | 6.5 %
| Managed Funds | [N/A] |
| 2 | NEXTERA ENERGY INC | 6.3 %
| United States | Utilities |
| 3 | DUKE ENERGY CORPORATION | 4.5 %
| United States | Utilities |
| 4 | American Tower Corporation American Tower Corp Ord USD0.01 | 4.3 %
| United States | Real Estate |
| 5 | SOUTHERN COMPANY (THE) | 4.1 %
| United States | Utilities |
| 6 | CHENIERE ENERGY | 3.9 %
| United States | Energy |
| 7 | UNION PACIFIC CORPORATION | 3.6 %
| United States | Industrials |
| 8 | ENTERGY CORPORATION | 3.4 %
| United States | Utilities |
| 9 | EVERSOURCE ENERGY | 3.4 %
| United States | Utilities |
| 10 | XCEL ENERGY | 3.1 %
| United States | Utilities |
|
FL Dual Aspect Analysis
|
|---|
| UK Equities | Int'l Equities | UK Bonds | Int'l Bonds | UK Gilts | Managed Funds | Property | Other | Cash & Equiv | Total |
| Telecommunications | | 0.9%
| | | | | | | | 0.9%
|
| Real Estate | | 7.1%
| | | | | | | | 7.1%
|
| Energy | | 8.7%
| | | | | | | | 8.7%
|
| Utilities | 3.6%
| 44.6%
| | | | | | | | 48.2%
|
| Industrials | | 28.1%
| | | | | | | | 28.1%
|
| Cash and Equivalents | | | | | | | | | 0.5%
| 0.5%
|
| Managed Funds | | | | | | 6.5%
| | | | 6.5%
|
| Non-Classified | | | | | | | | 0.0%
| | 0.0%
|
| Total | 3.6%
| 89.4%
| | | | 6.5%
| | 0.0%
| 0.5%
| 100.0%
|
Distribution Details
Income Frequency
Biannually
Distribution Payment Basis
Gross
Charges
Annual Management Charge
1.50%
Distribution Dates
| Ex dividend date(s) |
Income payment date(s) |
| 01st February |
30th March |
| 01st August |
30th September |
Aims & Benchmark
Benchmark
FTSE Global Core Infrastructure 50-50 Index
Aims
The Fund’s objective is to deliver capital growth and inflation-protected income by investing in a globally diversified portfolio of listed infrastructure and infrastructure-related securities.
Fund Administration
Fund Trustee/Depository
The Bank of New York Mellon (International) Limited
Fund Administrator
The Bank of New York Mellon (International) Limited
Fund Registrar
The Bank of New York Mellon (International) Limited
Fund Custodian
The Bank of New York Mellon (International) Limited
Fund Background
Valuation point
Daily 12:00
Fund currency
Pound Sterling
Fund domicile
United Kingdom
Group Details
Group name
First Sentier Investors (UK)
Group address
Finsbury Circus House
15 Finsbury Circus
London
EC2M 7EB
Group telephone
020 7332 6500
Dealing
Minimum regular savings
£50
Settlement period: buy
4 days
Settlement period: sell
4 days
Data accurate at: 31/03/2024
Concentration Coefficient*
30

*A measure of portfolio concentration, e.g. where the fund coefficient is 25, this means the portfolio concentration is equivalent to holding 25 equally weighted stocks.
Risk Factors
Concentrated Portfolio
Yes
Investments Long Term
Yes
| Fund Specific Risks |
-
Charges to Capital - Part, or all of the periodic annual management fee(s) and expenses may be charged to
capital which could increase the potential for the capital value of your investment to be eroded. Your capital could
also decrease if income withdrawals exceed the growth rate of the fund(s).
-
Emerging Markets - The fund invests in emerging markets. Generally less well regulated than the UK. There
is an increased chance of political and economic instability with less reliable custody, dealing and settlement
arrangements. The market(s) can be less liquid. If a fund investing in markets is affected by currency exchange rates,
the investment could either increase or decrease. These investments therefore carry more risk.
-
Concentrated Portfolio - The fund may invest in a relatively smaller number of stocks. This stock
concentration may carry more risk than funds spread across a larger number of companies.
-
Smaller Companies - The fund invests in smaller companies. Smaller companies shares can be more volatile
and less liquid than larger company shares, so smaller companies funds can carry more risk.
-
Sector Specific - The fund invests in specific sectors. Funds which invest in specific sectors may carry
more risk than those spread across a number of different sectors. They may assume higher risk, as markets/sectors can
be more volatile. In particular, gold, technology funds and other focused funds can suffer as the underlying stocks
can be more volatile and less liquid.
-
Value Of Investments - The value of investments, and any income can fall, as well as rise, so you could get
back less than you invested. Neither capital nor income is guaranteed.
-
Investments Long Term - Investments should be regarded as long term and are not suitable for money which may
be needed in the short term, you should always have a sufficient cash reserve.
-
Exchange Rate - This fund invests in securities outside the UK. The value of investments and any income from
them may therefore decrease or increase as a result of changes in exchange rates between currencies.
|

 Conventional Electricity
 United States
 Managed Funds
 Mexico
 United Kingdom
 France
 Australia
 Brazil
 Switzerland
 China
China Italy
Italy Hong Kong
 Japan
Japan Canada
 Spain
Spain Cash and Equivalents
 Non-Classified